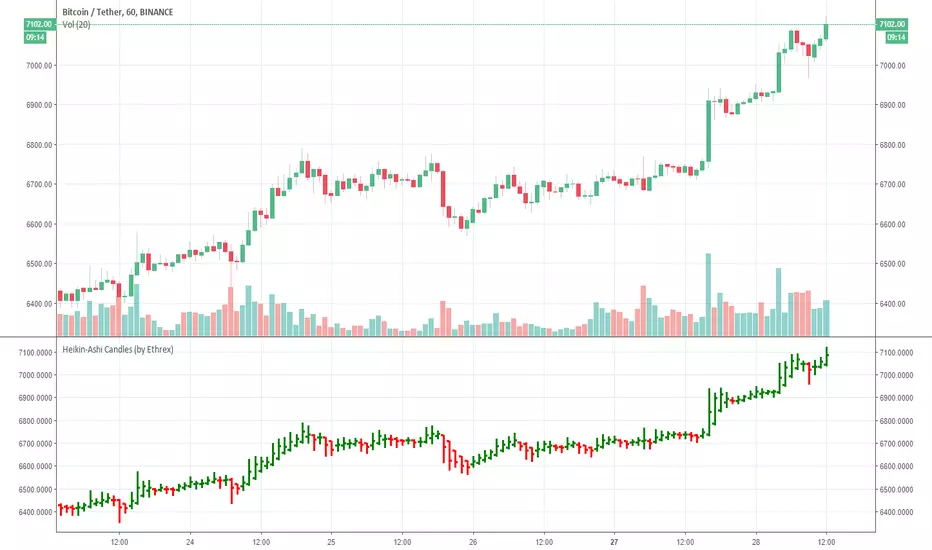
Heikin-Ashi Candles (by Ethrex)Allows to see how Heikin-Ashi candles are computed and see the bars side-by-side with normal prices.
Cerca negli script per "Heikin Ashi"
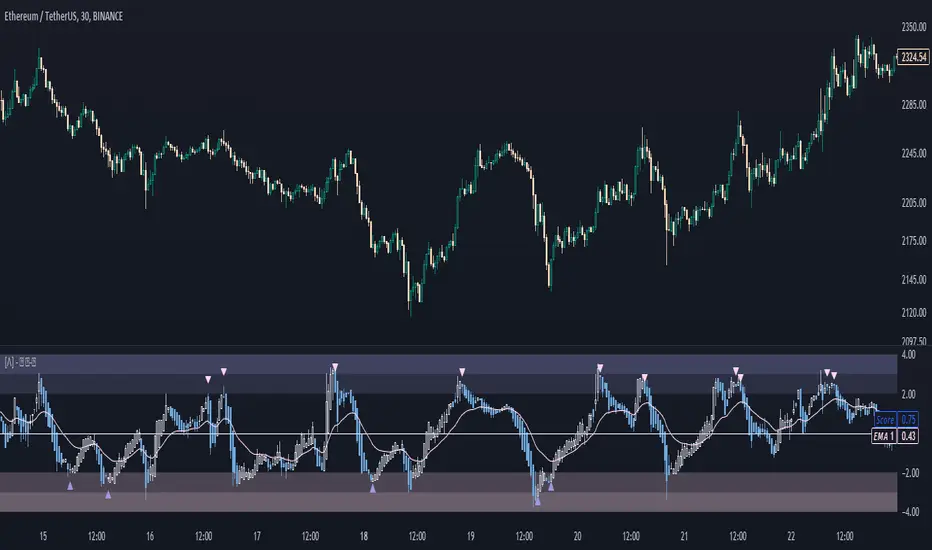
Heikin Ashi OscillatorTrigger (Current Period): Heikin Ashi candle heights are plotted to form and oscillator.
Trend (1W): A slower period is also plotted.
When Trend is rising, dips in the Trigger are buying opportunities
When Trend is descending, peaks in the Trigger are selling opportunities

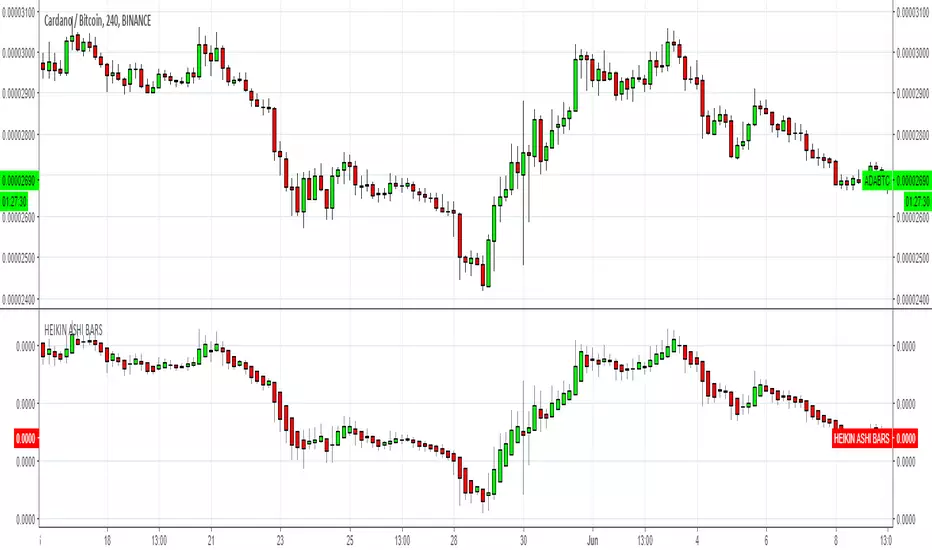
HEIKIN ASHI BARSSimple Heikin Ashi candlebars
Please consider a tip if you find this useful
BTC: 3FiBnveHo3YW6DSiPEmoCFCyCnsrWS3JBR
ETH: 0xac290B4A721f5ef75b0971F1102e01E1942A4578
On Balance Volume Heikin-Ashi Transformed
The OBV Heikin Ashi indicator is a modified version of the On-Balance Volume indicator that incorporates the Heikin Ashi transformation. This technical tool aims to provide traders with a smoother representation of volume dynamics and price trends.
The OBV Heikin Ashi indicator combines the principles of OBV and Heikin Ashi to offer insights into the volume and price behavior of an asset. Understanding OBV and Heikin Ashi individually will provide a foundation for comprehending the uniqueness and utility of this indicator.
On-Balance Volume:
OBV is a volume-based indicator that measures the cumulative buying and selling pressure in the market. It considers the relationship between volume and price movements to determine the overall strength and direction of a trend. Rising OBV values suggest bullish buying pressure, while falling values indicate bearish selling pressure.
Heikin Ashi:
Heikin Ashi is a Japanese candlestick charting technique that aims to filter out noise and provide a smoother representation of price trends. It calculates each candlestick based on the average of the previous candle's open, close, high, and low prices. Heikin Ashi candles can reveal the underlying trend more clearly by reducing market noise.
Methodology:
The 𝘖𝘉𝘝 𝘏-𝘈 indicator applies the Heikin Ashi transformation to the OBV values. Each OBV value is replaced with a Heikin Ashi equivalent, which is calculated based on the average of the previous Heikin Ashi candle's open and close prices. This transformation smooths out the OBV values and helps identify the overall trend with reduced noise. Additionaly, 2 optional EMAs are included for convergence-divergence analysis.
By applying the Heikin Ashi transformation to OBV, the indicator aims to enhance the readability of volume and trend information, providing traders with a clearer understanding of market dynamics.
Utility:
The 𝘖𝘉𝘝 𝘏-𝘈 indicator can be a valuable tool for traders and investors in analyzing volume and price trends. It offers a smoother representation of OBV values, allowing for easier identification of trend reversals, bullish or bearish market conditions, and potential trading opportunities. Traders can utilize the indicator to confirm price trends, validate support and resistance levels, and enhance their overall trading strategies.
It is worth noting that the effectiveness of the indicator may vary depending on the specific market and trading strategy. It is recommended to combine its analysis with other technical indicators and perform thorough backtesting before making trading decisions.
Key Features:
2 Adjustable EMAs
Normalized Oscillator Mode
Example Charts:
See Also:
Z-Score Heikin-Ashi Transformed

Z-Score Heikin-Ashi TransformedThe Z-Score Heikin-Ashi Transformed (𝘡 𝘏-𝘈) indicator is a powerful technical tool that combines the principles of Z-Score and Heikin Ashi to provide traders with a smoothed representation of price movements and a standardized measure of market volatility.
The 𝘡 𝘏-𝘈 indicator applies the Z-Score calculation to price data and then transforms the resulting Z-Scores using the Heikin Ashi technique. Understanding the individual components of Z-Score and Heikin Ashi will provide a foundation for comprehending the methodology and unique features of this indicator.
Z-Score:
Z-Score is a statistical measure that quantifies the distance between a data point and the mean, relative to the standard deviation. It provides a standardized value that allows traders to compare different data points on a common scale. In the context of the 𝘡 𝘏-𝘈 indicator, Z-Score is calculated based on price data, enabling the identification of extreme price movements and the assessment of their significance.
Heikin Ashi:
Heikin Ashi is a popular charting technique that aims to filter out market noise and provide a smoother representation of price trends. It involves calculating each candlestick based on the average of the previous candle's open, close, high, and low prices. This approach results in a chart that reduces the impact of short-term price fluctuations and reveals the underlying trend more clearly.
Methodology:
The 𝘡 𝘏-𝘈 indicator starts by calculating the Z-Score of the price data, which provides a standardized measure of how far each price point deviates from the mean. Next, the resulting Z-Scores are transformed using the Heikin Ashi technique. Each Z-Score value is modified according to the Heikin Ashi formula, which incorporates the average of the previous Heikin Ashi candle's open and close prices. This transformation smooths out the Z-Score values and reduces the impact of short-term price fluctuations, providing a clearer view of market trends.
This tool enables traders to identify significant price movements and assess their relative strength compared to historical data. Positive transformed Z-Scores indicate that prices are above the average, suggesting potential overbought conditions, while negative transformed Z-Scores indicate prices below the average, suggesting potential oversold conditions. Traders can utilize this information to identify potential reversals, confirm trend strength, and generate trading signals.
Utility:
The indicator offers valuable insights into price volatility and trend analysis. By combining the standardized measure of Z-Score with the smoothing effect of Heikin Ashi, traders can make more informed trading decisions and improve their understanding of market dynamics. 𝘡 𝘏-𝘈 can be used in various trading strategies, including identifying overbought or oversold conditions, confirming trend reversals, and establishing entry and exit points.
Note that the 𝘡 𝘏-𝘈 should be used in conjunction with other technical indicators and analysis tools to validate signals and avoid false positives. Additionally, traders are encouraged to conduct thorough backtesting and experimentation with different parameter settings to optimize the effectiveness of the indicator for their specific trading approach.
Key Features:
Optional Reversion Doritos
Adjustable Reversion Threshold
2 Adjustable EMAs
Example Charts:
See Also:
On Balance Volume Heikin-Ashi Transformed
Ichimoku w/Heikin-Ashi Ichimoku w/Heikin-Ashi displays the Heikin-Ashi and leading lagging span of Ichimoku Kinko Hyo.
If you change to Heikin-Ashi as it is, the basis of the calculation of Ichimoku will also use the Heikin-Ashi, so after displaying the Heikin-Ashi independently, then the calculation uses the original candlestick.
Initially, two candlesticks are displayed so that you can switch between candlesticks and Heikin-Ashi. If you uncheck the standard candlesticks check box to hide them, only Heikin-Ashi will be displayed.
In addition, the lagging span is displayed as the leading lagging span in order to align the viewpoint to one current place.
一目均衡表の遅行スパンを先行させ、平均足を表示させる指標です。
標準のまま平均足に変更すると均衡表の計算のベースも平均足を使ってしまうため、平均足を独立して表示させた上で計算は元のローソク足を使用しています。
ローソク足と平均足を切り替えられるように、最初は2つのローソク足が表示されますが、標準のローソク足のチェックボックスを外して非表示とすれば平均足のみの表示となります。
また視点を現在の1箇所に揃えるために遅行スパンを先行遅行スパンとして表示しています。

OBV based on Heikin-AshiDescription
This indicator calculates the On-Balance Volume (OBV) based on Heikin-Ashi candles rather than regular candlesticks.
OBV based on Heikin-Ashi: The OBV is calculated based on Heikin-Ashi candle trends. Volume is added when the Heikin-Ashi close is above the open (bullish) and subtracted when the close is below the open (bearish).
Volume Analysis: This approach helps traders identify significant volume shifts in a smoother trend environment, reducing market noise that often accompanies traditional candlestick charts.
説明
このインジケーターは、通常のローソク足ではなく、平均足(Heikin-Ashi)を基にオンバランス・ボリューム(OBV)を計算します。
平均足に基づくOBV: OBVは、平均足のトレンドに基づいて計算されます。平均足の終値が始値を上回った場合(陽線)は出来高が加算され、終値が始値を下回った場合(陰線)は出来高が減算されます。
出来高分析: この手法により、通常のローソク足チャートで発生するノイズを軽減し、滑らかなトレンド環境で重要な出来高の変化を把握できます。

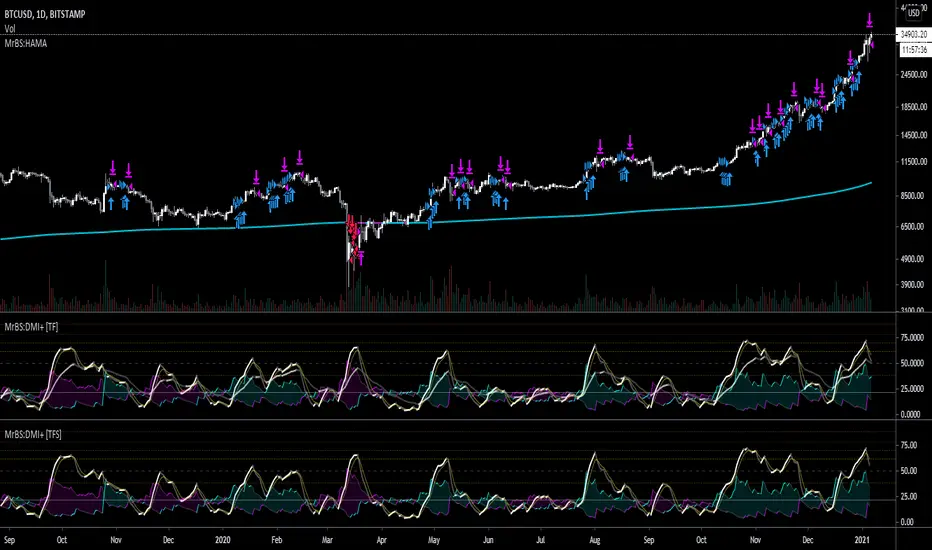
MrBS:EMA/SMA/HMA (Heikin Ashi Calc)This indicator allows you to base the MA calculation from Heikin Ashi values on normal charts and/or the real OHLC values while looking at Heikin Ashi.
There are 3 MA types you can select - EMA / SMA / HMA
The colour is based on the slope.
I made this to help me visualize my DMI+ strategy, when I was looking at taking signals from Heikin Ashi but looking at candlesticks. Turns out, I was going down the wrong road. Now I'm looking into using the real OHLC values for generating signals but watching the Heikin Ashi chart as I find it easier to see trends on it.
Hopefully its useful to some people, and if you have any suggestions for improvements I'd love to know.
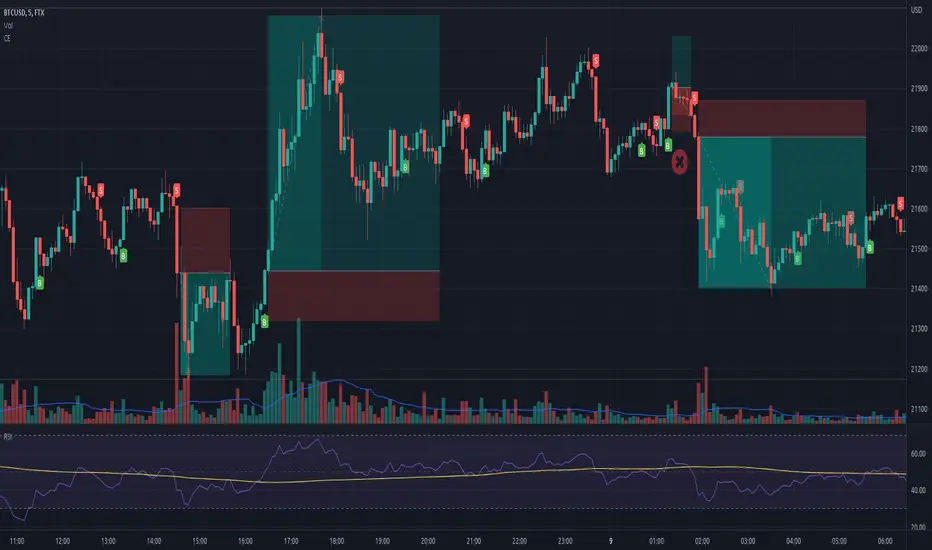
Chandelier Exit - Heikin AshiThis is a redesign of the Chandelier Exit indicator. It removes stupid transitions between Chandelier Exit' states and highlights initial points for both lines.
This indicator was originally developed by Charles Le Beau and popularized by Dr . Alexander Elder in his book "Come Into My Trading Room: A Complete Guide to Trading" (2002).
In short, this is a trailing stop-loss based on the Average True Range (ATR).
If "Heikin Ashi for calculation" is checked, then ATR and buy/sell signals are calculated based on heikin ashi candles.
You don't need to change bar style to heikin ashi.
Thanks to everget for the initial version.
Optimized Heikin Ashi Strategy with Buy/Sell OptionsStrategy Name:
Optimized Heikin Ashi Strategy with Buy/Sell Options
Description:
The Optimized Heikin Ashi Strategy is a trend-following strategy designed to capitalize on market trends by utilizing the smoothness of Heikin Ashi candles. This strategy provides flexible options for trading, allowing users to choose between Buy Only (long-only), Sell Only (short-only), or using both in alternating conditions based on the Heikin Ashi candle signals. The strategy works on any market, but it performs especially well in markets where trends are prevalent, such as cryptocurrency or Forex.
This script offers customizable parameters for the backtest period, Heikin Ashi timeframe, stop loss, and take profit levels, allowing traders to optimize the strategy for their preferred markets or assets.
Key Features:
Trade Type Options:
Buy Only: Enter a long position when a green Heikin Ashi candle appears and exit when a red candle appears.
Sell Only: Enter a short position when a red Heikin Ashi candle appears and exit when a green candle appears.
Stop Loss and Take Profit:
Customizable stop loss and take profit percentages allow for flexible risk management.
The default stop loss is set to 2%, and the default take profit is set to 4%, maintaining a favorable risk/reward ratio.
Heikin Ashi Timeframe:
Traders can select the desired timeframe for Heikin Ashi candle calculation (e.g., 4-hour Heikin Ashi candles for a 1-hour chart).
The strategy smooths out price action and reduces noise, providing clearer signals for entry and exit.
Inputs:
Backtest Start Date / End Date: Specify the period for testing the strategy’s performance.
Heikin Ashi Timeframe: Select the timeframe for Heikin Ashi candle generation. A higher timeframe helps smooth the trend, which is beneficial for trading lower timeframes.
Stop Loss (in %) and Take Profit (in %): Enable or disable stop loss and take profit, and adjust the levels based on market conditions.
Trade Type: Choose between Buy Only or Sell Only based on your market outlook and strategy preference.
Strategy Performance:
In testing with BTC/USD, this strategy performed well in a 4-hour Heikin Ashi timeframe applied on a 1-hour chart over a period from January 1, 2024, to September 12, 2024. The results were as follows:
Initial Capital: 1 USD
Order Size: 100% of equity
Net Profit: +30.74 USD (3,073.52% return)
Percent Profitable: 78.28% of trades were winners.
Profit Factor: 15.825, indicating that the strategy's profitable trades far outweighed its losses.
Max Drawdown: 4.21%, showing low risk exposure relative to the large profit potential.
This strategy is ideal for both beginner and advanced traders who are looking to follow trends and avoid market noise by using Heikin Ashi candles. It is also well-suited for traders who prefer automated risk management through the use of stop loss and take profit levels.
Recommended Use:
Best Markets: This strategy works well on trending markets like cryptocurrency, Forex, or indices.
Timeframes: Works best when applied to lower timeframes (e.g., 1-hour chart) with a higher Heikin Ashi timeframe (e.g., 4-hour candles) to smooth out price action.
Leverage: The strategy performs well with leverage, but users should consider using 2x to 3x leverage to avoid excessive risk and potential liquidation. The strategy's low drawdown allows for moderate leverage use while maintaining risk control.
Customization: Traders can adjust the stop loss and take profit percentages based on their risk appetite and market conditions. A default setting of a 2% stop loss and 4% take profit provides a balanced risk/reward ratio.
Notes:
Risk Management: Traders should enable stop loss and take profit settings to maintain effective risk management and prevent large drawdowns during volatile market conditions.
Optimization: This strategy can be further optimized by adjusting the Heikin Ashi timeframe and risk parameters based on specific market conditions and assets.
Backtesting: The built-in backtesting functionality allows traders to test the strategy across different market conditions and historical data to ensure robustness before applying it to live trading.
How to Apply:
Select your preferred market and chart.
Choose the appropriate Heikin Ashi timeframe based on the chart's timeframe. (e.g., use 4-hour Heikin Ashi candles for 1-hour chart trends).
Adjust stop loss and take profit based on your risk management preference.
Run backtesting to evaluate its performance before applying it in live trading.
This strategy can be further modified and optimized based on personal trading style and market conditions. It’s important to monitor performance regularly and adjust settings as needed to align with market behavior.

RF+ Replay for Heikin AshiRF+ Replay for Heikin Ashi
RF+ Replay for Heikin Ashi generates fully customisable Heikin Ashi candlesticks presented on a standard chart, enabling traders to utilise the Tradingview Replay feature with Heikin Ashi candlesticks when analysing and backtesting HA style strategies.
The features of this indicator include:
- Fully customisable Heikin Ashi Candles, including custom colour options for candle bodies, borders and wicks.
- Optional real-time, real-price close dots painted onto each candlestick.
- A optional set of 2 x Range Filters designed to indicate short term trend identification upon color change, ideal for low timeframe scalping.
- A optional set of 3 x fully customisable Moving Averages.
- An option to enable Heikin Ashi calculated data for the Range Filters and Moving Averages, so they present as they would on a Heikin Ashi non-standard chart type, without having to use an actual Heikin Ashi chart. Enabled by default.
- An optional sessions indicator, to highlight your prefered trading session for the purpose of backtesting.
- An optional watermark featuring customisable text and well as symbol and timeframe information, as seen in the screenshot of this indicator.
Instructions for use:
1) Because this indicator generates candlesticks and presents them onto your chart, you will need to hide the existing candlesticks so you do not see two sets of candles. You can do this by going into your Tradingview chart settings and making the candle bodies, borders and wicks fully transparent. You can then save this as a layout template. You can access your Chart Settings by clicking on the cog icon, or by right clicking on the chart itself and selecting 'Chart Settings' from the list.
2) Ensure you have the standard chart type selected - you do not need to select a Heikin Ashi type chart.
3) You will now be able to analyise and even backtest your Heikin Ashi style strategies including the use of the Tradingview Replay feature found at the top of the chart.
Heikin Ashi means 'average bar' in Japanese, which speaks to the fact that Heikin Ashi candles are calculated differently to standard Japanese candlesticks. The general idea of Heikin Ashi candles is to 'smooth' the appearance of price movement, by the use of averages within their calculation. It is important to understand that the Open and Close values of a Heikin Ashi candlestick do not reflect real Open and Close prices. You can use the real price dots feature to clearly see the real time and real price Close of each candle.
The formula for calculating a Heikin Ashi candlestick is as follows:
High = Maximum of High, Open, or Close (whichever is highest)
Low = Minimum of Low, Open, or Close (whichever is lowest)
Open = Open (previous bar) + Close (previous bar) /2
Close = (Open + High + Low + Close) / 4
If you found this useful, be sure to leave a like, comment and subscribe to show your support.
Until next time.

Wickless Heikin Ashi B/S [CHE]Wickless Heikin Ashi B/S \
Purpose.
Wickless Heikin Ashi B/S \ is built to surface only the cleanest momentum turns: it prints a Buy (B) when a bullish Heikin-Ashi candle forms with virtually no lower wick, and a Sell (S) when a bearish Heikin-Ashi candle forms with no upper wick. Optional Lock mode turns these into one-shot signals that hold the regime (bull or bear) until the opposite side appears. The tool can also project dashed horizontal lines from each signal’s price level to help you manage entries, stops, and partial take-profits visually.
How it works.
The indicator computes standard Heikin-Ashi values from your chart’s OHLC. A bar qualifies as bullish if its HA close is at or above its HA open; bearish if below. Then the wick on the relevant side is compared to the bar’s HA range. If that wick is smaller than your selected percentage threshold (plus a tiny tick epsilon to avoid rounding noise), the raw condition is considered “wickless.” Only one side can fire; on the rare occasion both raw conditions would overlap, the bar is ignored to prevent false dual triggers. When Lock is enabled, the first valid signal sets the active regime (background shaded light green for bull, light red for bear) and suppresses further same-side triggers until the opposite side appears, which helps reduce overtrading in chop.
Why wickless?
A missing wick on the “wrong” side of a Heikin-Ashi candle is a strong hint of persistent directional pressure. In practice, this filters out hesitation bars and many mid-bar flips. Traders who prefer entering only when momentum is decisive will find wickless bars useful for timing entries within an established bias.
Visuals you get.
When a valid buy appears, a small triangle “B” is plotted below the bar and a green dashed line can extend to the right from the signal’s HA open price. For sells, a triangle “S” above the bar and a red dashed line do the same. These lines act like immediate, price-anchored references for stop placement and profit scaling; you can shift the anchor left by a chosen number of bars if you prefer the line to start a little earlier for visual alignment.
How to trade it
Establish context first.
Pick a timeframe that matches your style: intraday index or crypto traders often use 5–60 minutes; swing traders might prefer 2–4 hours or daily. The tool is agnostic, but the cleanest results occur when the market is already trending or attempting a fresh breakout.
Entry.
When a B prints, the simplest rule is to enter long at or just after bar close. A conservative variation is to require price to take out the high of the signal bar in the next bar(s). For S, invert the logic: enter short on or after close, or only if price breaks the signal bar’s low.
Stop-loss.
Place the stop beyond the opposite extreme of the signal HA bar (for B: under the HA low; for S: above the HA high). If you prefer a static reference, use the dashed line level (signal HA open) or an ATR buffer (e.g., 1.0–1.5× ATR(14)). The goal is to give the trade enough room that normal noise does not immediately knock you out, while staying small enough to keep the risk contained.
Take-profit and management.
Two pragmatic approaches work well:
R-multiple scaling. Define your initial risk (distance from entry to stop). Scale out at 1R, 2R, and let a runner go toward 3R+ if structure holds.
Trailing logic. Trail behind a short moving average (e.g., EMA 20) or progressive swing points. Many traders also exit on the opposite signal when Lock flips, especially on faster timeframes.
Position sizing.
Keep risk per trade modest and consistent (e.g., 0.25–1% of account). The indicator improves timing; it does not replace risk control.
Settings guidance
Max lower wick for Bull (%) / Max upper wick for Bear (%).
These control how strict “wickless” must be. Tighter values (0.3–1.0%) yield fewer but cleaner signals and are great for strong trends or low-noise instruments. Looser values (1.5–3.0%) catch more setups in volatile markets but admit more noise. If you notice too many borderline bars triggering during high-volatility sessions, increase these thresholds slightly.
Lock (one-shot until opposite).
Keep Lock ON when you want one decisive signal per leg, reducing noise and signal clusters. Turn it OFF only if your plan intentionally scales into trends with multiple entries.
Extended lines & anchor offset.
Leave lines ON to maintain a visual memory of the last trigger levels. These often behave like near-term support/resistance. The offset simply lets you start that line one or more bars earlier if you prefer the look; it does not change the math.
Colors.
Use distinct bull/bear line colors you can read easily on your theme. The default lime/red scheme is chosen for clarity.
Practical examples
Momentum continuation (long).
Price is above your baseline (e.g., EMA 200). A B prints with a tight lower wick filter. Enter on close; stop under the signal HA low. Price pushes up in the next bars; you scale at 1R, trail the rest with EMA 20, and finally exit when a distant S appears or your trail is hit.
Breakout confirmation (short).
Following a range, price breaks down and prints an S with no upper wick. Enter short as the bar closes or on a subsequent break of the signal bar’s low. If the next bar immediately rejects and prints a bullish HA bar, your stop above the signal HA high limits damage. Otherwise, ride the move, harvesting partials as the red dashed line remains unviolated.
Alerts and automation
Set alerts to “Once Per Bar Close” for stability.
Bull ONE-SHOT fires when a valid buy prints (and Lock allows it).
Bear ONE-SHOT fires for sells analogously.
With Lock enabled, you avoid multiple pings in the same direction during a single leg—useful for webhooks or mobile notifications.
Reliability and limitations
The script calculates from completed bars and does not use higher-timeframe look-ahead or repainting tricks. Heikin-Ashi smoothing can lag turns slightly, which is expected and part of the design. In narrow ranges or whipsaw conditions, signals naturally thin out; if you must trade ranges, either tighten the wick filters and keep Lock ON, or add a trend/volatility filter (e.g., trade B only above EMA 200; S only below). Remember: this is an indicator, not a strategy. If you want exact statistics, port the triggers into a strategy and backtest with your chosen entry, stop, and exit rules.
Final notes
Wickless Heikin Ashi B/S \ is a precision timing tool: it waits for decisive, wickless HA bars, provides optional regime locking to reduce noise, and leaves clear price anchors on your chart for disciplined management. Use it with a simple framework—trend bias, fixed risk, and a straightforward exit plan—and it will keep your execution consistent without cluttering the screen or your decision-making.
Disclaimer: This indicator is for educational use and trade assistance only. It is not financial advice. You alone are responsible for your risk and results.
Enhance your trading precision and confidence with Wickless Heikin Ashi B/S ! 🚀
Happy trading
Chervolino

Real Price Line + Dots (for Heikin Ashi)Real Price Line + Dots (for Heikin Ashi)
This indicator is designed for use on Heikin Ashi charts. Its purpose is to enable traders to benefit from price averaging and smoothing effects of Heikin Ashi candles whilst also enabling them to see the current real price line, and optionally, real price close dots on the Heikin Ashi candlesticks.
Features include:
- Optional real price line
- Optional real price close dots
- Customisable colours
- Customisable line style
- Customisable line width
What are Heikin Ashi candles?
Heikin Ashi means 'average bar' in Japanese, Heikin Ashi charts do not show real price as standard, due to the way the Open, High, Low and Close values are calculated using averages, This is done in order to create a smoother appearance and reduce the market 'noise'.
You can read more about Heikin Ashi candlesticks here.
NOTE:
- If real price dots appear behind the candles, you may need to select the triple dot menu on the indicator then select "Visual order" > "Bring to front" , so that the dots are shown above the candles.
- When using this indicator on a Heikin Ashi chart, the standard Tradingview price line will not show accurate real price. Therefore when using the price line in this indicator, the standard price line should be disabled within the Tradingview 'Chart settings' dialog > 'Symbol' tab > uncheck 'Last', under the 'Price line' section.

Smoothed RSI Heikin Ashi Oscillator w/ Expanded Types [Loxx]Smoothed RSI Heikin-Ashi Oscillator w/ Expanded Types is a spin on Heikin Ashi RSI Oscillator by @JayRogers. The purpose of this modification is to reduce noise in the original version thereby increasing suitability of the signal output. This indicator is tuned for Forex markets.
Differences:
35+ Smoothing Options for RSI
35+ Smoothing Options for HA Candles
Heiken-Ashi Better Expanded Source input. This source input is use for the RSI calculation only.
Signals
Alerts
What are Heiken-Ashi "better" candles?
The "better formula" was proposed in an article/memo by BNP-Paribas (In Warrants & Zertifikate, No. 8, August 2004 (a monthly German magazine published by BNP Paribas, Frankfurt), there is an article by Sebastian Schmidt about further development (smoothing) of Heikin-Ashi chart.)
They proposed to use the following :
(Open+Close)/2+(((Close-Open)/( High-Low ))*ABS((Close-Open)/2))
instead of using :
haClose = (O+H+L+C)/4
According to that document the HA representation using their proposed formula is better than the traditional formula.
What are traditional Heiken-Ashi candles?
The Heikin-Ashi technique averages price data to create a Japanese candlestick chart that filters out market noise.
Heikin-Ashi charts, developed by Munehisa Homma in the 1700s, share some characteristics with standard candlestick charts but differ based on the values used to create each candle. Instead of using the open, high, low, and close like standard candlestick charts, the Heikin-Ashi technique uses a modified formula based on two-period averages. This gives the chart a smoother appearance, making it easier to spots trends and reversals, but also obscures gaps and some price data.
Future updates
Expand signal options to include RSI-, Zero-, and color-crosses

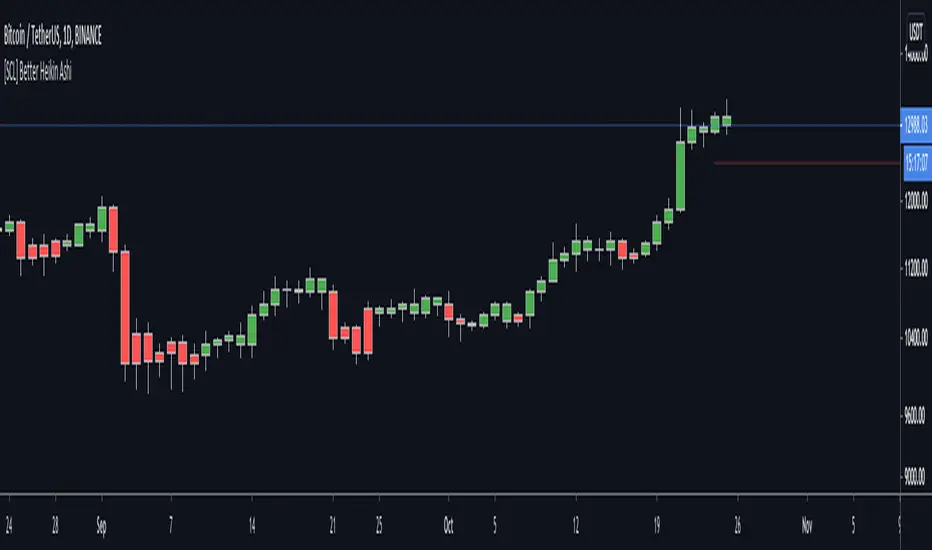
[SCL] Better Heikin AshiTo display the Heikin Ashi candle direction on your normal chart, using this script is better than switching between layouts. It includes different display modes so that you can use it alongside other indicators without clashing visually (bar colour/plotted shapes/shapes on flip only), and alerts on changes in direction. Many scripts include some or other of these features; here I've included them all in one for flexibility. One feature that AFAIK is unique is the "predictive close", which shows you where the current candle needs to close in order to change the Heikin Ashi direction.
Heikin Ashi is a different method of calculating candlesticks. It has several advantages:
+ It can help to show the dominant trend in a smoother way than normal candles.
+ Flips in direction can show either trend reversal, or a pause and continuation, which can be a place to join a trend.
Disadvantages of using Heikin Ashi include:
+ Having to change to a different chart layout
+ Difficulties working directly with Heikin Ashi values, because the values of the Open, Low, High, and Close displayed are different to the "real" prices.
This indicator solves this problem by bringing trend information from Heikin Ashi candles (whether they're bullish or bearish) onto your normal candle chart. It displays in the main chart pane.
quit your bullshit! Heikin-Ashi Backtest with Real Candle ValuesMade in a few minutes to debunk all the bullshit going around tradingview and everywhere about "heikin-ashi" being a holy grail trend indicator.
Do not be deceived.
Heikin-Ashi is a beautiful way to remove much of the noise in markets, and is light on the eyes. (nice and smooth!)
I personally use heikin-ashi as a way to remove a lot of the clutter in the markets, allowing me to trade with less emotion.
While heikin-ashi is a great way to visualize trends, it is NOT a good trend indicator because its displayed values do not align with actual trading values.
Therefore, entry and exit points for many of the ideas published about heikin-ashi for trade are inaccurate.
::: When Heikin-Ashi changes colour for x candles, a new trade is created on the open of the following real candle.
In practice, Heikin-Ashi is much closer to break even.
As tested, Heikin-Ashi trend trading works better on pairs that have clearer definitions of trends and are less often in consolidation. (ex. USDJPY)
Usage:
Switch to normal candlestick chart.
Features:
Change the period for new trades. (For example: x amount of red candles after a green candle to signify short trade)

Adaptive Heikin Ashi [CHE]Adaptive Heikin Ashi — volatility-aware HA with fewer fake flips
Summary
Adaptive Heikin Ashi is a volatility-aware reinterpretation of classic Heikin Ashi that continuously adjusts its internal smoothing based on the current ATR regime, which means that in quiet markets the indicator reacts more quickly to genuine directional changes, while in turbulent phases it deliberately increases its smoothing to suppress jitter and color whipsaws, thereby reducing “noise” and cutting down on fake flips without resorting to heavy fixed smoothing that would lag everywhere.
Motivation: why adapt at all?
Classic Heikin Ashi replaces raw OHLC candles with a smoothed construction that averages price and blends each new candle with the previous HA state, which typically cleans up trends and improves visual coherence, yet its fixed smoothing amount treats calm and violent markets the same, leading to the usual dilemma where a setting that looks crisp in a narrow range becomes too nervous in a spike, and a setting that tames high volatility feels unnecessarily sluggish as soon as conditions normalize; by allowing the smoothing weight to expand and contract with volatility, Adaptive HA aims to keep candles readable across shifting regimes without constant manual retuning.
What is different from normal Heikin Ashi?
Fixed vs. adaptive blend:
Classic HA implicitly uses a fixed 50/50 blend for the open update (`HA_open_t = 0.5 HA_open_{t-1} + 0.5 HA_close_{t-1}`), while this script replaces the constant 0.5 with a dynamic weight `w_t` that oscillates around 0.5 as a function of observed volatility, which turns the open update into an EMA-like filter whose “alpha” automatically changes with market conditions.
Volatility as the steering signal:
The script measures volatility via ATR and compares it to a rolling baseline (SMA of ATR over the same length), producing a normalized deviation that is scaled by sensitivity, clamped to ±1 for stability, and then mapped to a bounded weight interval ` `, so the adaptation is strong enough to matter but never runs away.
Outcome that matters to traders:
In high volatility, the weight shifts upward toward the prior HA open, which strengthens smoothing exactly where classic HA tends to “chatter,” while in low volatility the weight shifts downward toward the most recent HA close, which speeds up reaction so quiet trends do not feel artificially delayed; this is the practical mechanism by which noise and fake signals are reduced without accepting blanket lag.
How it works
1. HA close matches classic HA:
`HA_close_t = (Open_t + High_t + Low_t + Close_t) / 4`
2. Volatility normalization:
`ATR_t` is computed over `atr_length`, its baseline is `ATR_SMA_t = SMA(ATR, atr_length)`, and the raw deviation is `(ATR_t / ATR_SMA_t − 1)`, which is then scaled by `adapt_sensitivity` and clamped to ` ` to obtain `v_t`, ensuring that pathological spikes cannot destabilize the weighting.
3. Adaptive weight around 0.5:
`w_t = 0.5 + oscillation_range v_t`, giving `w_t ∈ `, so with a default `range = 0.20` the weight stays between 0.30 and 0.70, which is wide enough to matter but narrow enough to preserve HA identity.
4. EMA-like open update:
On the very first bar the open is seeded from a stable combination of the raw open and close, and thereafter the update is
`HA_open_t = w_t HA_open_{t−1} + (1 − w_t) HA_close_{t−1}`,
which is equivalent to an EMA where higher `w_t` means heavier inertia (more smoothing) and lower `w_t` means stronger pull to the latest price information (more responsiveness).
5. High and low follow classic HA composition:
`HA_high_t = max(High_t, max(HA_open_t, HA_close_t))`,
`HA_low_t = min(Low_t, min(HA_open_t, HA_close_t))`,
thereby keeping visual semantics consistent with standard HA so that your existing reading of bodies, wicks, and transitions still applies.
Why this reduces noise and fake signals in practice
Fake flips in HA typically occur when a fixed blending rule is forced to process candles during a volatility surge, producing rapid alternations around pivots or within wide intrabar ranges; by increasing smoothing exactly when ATR jumps relative to its baseline, the adaptive open stabilizes the candle body progression and suppresses transient color changes, while in the opposite scenario of compressed ranges, the reduced smoothing allows small but persistent directional pressure to reflect in candle color earlier, which reduces the tendency to enter late after multiple slow transitions.
Parameter guide (what each input really does)
ATR Length (default 14): controls both the ATR and its baseline window, where longer values dampen the adaptation by making the baseline slower and the deviation smaller, which is helpful for noisy lower timeframes, while shorter values make the regime detector more reactive.
Oscillation Range (default 0.20): sets the maximum distance from 0.5 that the weight may travel, so increasing it towards 0.25–0.30 yields stronger smoothing in turbulence and faster response in calm periods, whereas decreasing it to 0.10–0.15 keeps the behavior closer to classical HA and is useful if your strategy already includes heavy downstream smoothing.
Adapt Sensitivity (default 6.0): multiplies the normalized ATR deviation before clamping, such that higher sensitivity accelerates adaptation to regime shifts, while lower sensitivity produces gradual transitions; negative values intentionally invert the mapping (higher vol → less smoothing) and are generally not recommended unless you are testing a counter-intuitive hypothesis.
Reading the candles and the optional diagnostic
You interpret colors and bodies just like with normal HA, but you can additionally enable the Adaptive Weight diagnostic plot to see the regime in real time, where values drifting up toward the upper bound indicate a turbulent context that is being deliberately smoothed, and values gliding down toward the lower bound indicate a calm environment in which the indicator chooses to move faster, which can be valuable for discretionary confirmation when deciding whether a fresh color shift is likely to stick.
Practical workflows and combinations
Trend-following entries: use color continuity and body expansion as usual, but expect fewer spurious alternations around news spikes or into liquidity gaps; pairing with structure (swing highs/lows, breaks of internal ranges) keeps entries disciplined.
Exit management: when the diagnostic weight remains elevated for an extended period, you can be stricter with exit triggers because flips are less likely to be accidental noise; conversely, when the weight is depressed, consider earlier partials since the indicator is intentionally more nimble.
Multi-asset, multi-TF: the adaptation is especially helpful if you rotate instruments with very different vol profiles or hop across timeframes, since you will not need to retune a fixed smoothing parameter every time conditions change.
Behavior, constraints, and performance
The script does not repaint historical bars and uses only past information on closed candles, yet just like any candle-based visualization the current live bar will update until it closes, so you should avoid acting on mid-bar flips without a rule that accounts for bar close; there are no `security()` calls or higher-timeframe lookups, which keeps performance light and execution deterministic, and the clamping of the volatility signal ensures numerical stability even during extreme ATR spikes.
Sensible defaults and quick tuning
Start with the defaults (`ATR 14`, `Range 0.20`, `Sensitivity 6.0`) and observe the weight plot across a few volatile events; if you still see too many flips in turbulence, either raise `Range` to 0.25 or trim `Sensitivity` to 4–5 so that the weight can move high but does not overreact, and if the indicator feels too slow in quiet markets, lower `Range` toward 0.15 or raise `Sensitivity` to 7–8 to bias the weight a bit more aggressively downward when conditions compress.
What this indicator is—and is not
Adaptive Heikin Ashi is a context-aware visualization layer that improves the signal-to-noise ratio and reduces fake flips by modulating smoothing with volatility, but it is not a complete trading system, it does not predict the future, and it should be combined with structure, risk controls, and position management that fit your market and timeframe; always forward-test on your instruments, and remember that even adaptive smoothing can delay recognition at sharp turning points when volatility remains elevated.
Disclaimer
The content provided, including all code and materials, is strictly for educational and informational purposes only. It is not intended as, and should not be interpreted as, financial advice, a recommendation to buy or sell any financial instrument, or an offer of any financial product or service. All strategies, tools, and examples discussed are provided for illustrative purposes to demonstrate coding techniques and the functionality of Pine Script within a trading context.
Any results from strategies or tools provided are hypothetical, and past performance is not indicative of future results. Trading and investing involve high risk, including the potential loss of principal, and may not be suitable for all individuals. Before making any trading decisions, please consult with a qualified financial professional to understand the risks involved.
By using this script, you acknowledge and agree that any trading decisions are made solely at your discretion and risk.
Best regards and happy trading
Chervolino

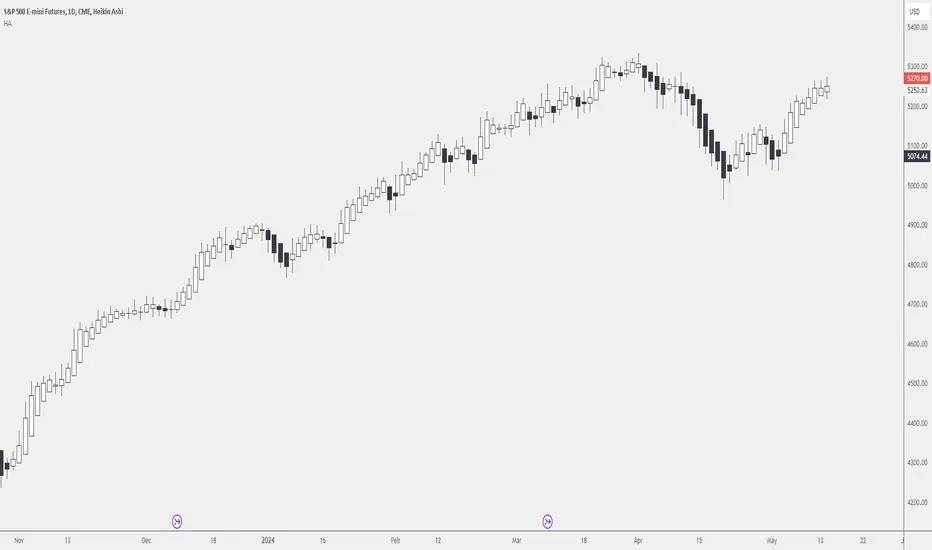
10/20 MA Cross-Over with Heikin-Ashi Signals by SchobbejakThe 10/20 MA Heikin-Ashi Strategy is the best I know. It's easy, it's elegant, it's effective.
It's particularly effective in markets that trend on the daily. You may lose some money when markets are choppy, but your loss will be more than compensated when you're aboard during the big moves at the beginning of a trend or after retraces. There's that, and you nearly eliminate the risk of losing your profit in the long run.
The results are good throughout most assets, and at their best when an asset is making new all-time highs.
It uses two simple moving averages: the 10 MA (blue), and the 20 MA (red), together with heikin-ashi candles. Now here's the great thing. This script does not change your regular candles into heikin-ashi ones, which would have been annoying; instead, it subtly prints either a blue dot or a red square around your normal candles, indicating a heikin-ashi change from red to green, or from green to red, respectively. This way, you get both regular and heikin ashi "candles" on your chart.
Here's how to use it.
Go LONG in case of ALL of the below:
1) A blue dot appeared under the last daily candle (meaning the heikin-ashi is now "green").
2) The blue MA-line is above the red MA-line.
3) Price has recently breached the blue MA-line upwards, and is now above.
COVER when one or more of the above is no longer the case. This is very important. You want to keep your profit.
Go SHORT in case of ALL of the below:
1) A red square appeared above the last daily candle (meaning the heikin-ashi is now "red").
2) The red MA-line is above the blue MA-line.
3) Price has recently breached the blue MA-line downwards, and is now below.
Again, COVER when one or more of the above is no longer the case. This is what gives you your edge.
It's that easy.
Now, why did I make the signal blue, and not green? Because blue looks much better with red than green does. It's my firm believe one does not become rich using ugly charts.
Good luck trading.
--You may tip me using bitcoin: bc1q9pc95v4kxh6rdxl737jg0j02dcxu23n5z78hq9 . Much appreciated!--

Smoothed Heikin Ashi Trend on Chart - TraderHalai BACKTESTSmoothed Heikin Ashi Trend on chart - Backtest
This is a backtest of the Smoothed Heikin Ashi Trend indicator, which computes the reverse candle close price required to flip a Heikin Ashi trend from red to green and vice versa. The original indicator can be found in the scripts section of my profile.
This particular back test uses this indicator with a Trend following paradigm with a percentage-based stop loss.
Note, that backtesting performance is not always indicative of future performance, but it does provide some basis for further development and walk-forward / live testing.
Testing was performed on Bitcoin , as this is a primary target market for me to use this kind of strategy.
Sample Backtesting results as of 10th June 2022:
Backtesting parameters:
Position size: 10% of equity
Long stop: 1% below entry
Short stop: 1% above entry
Repainting: Off
Smoothing: SMA
Period: 10
8 Hour:
Number of Trades: 1046
Gross Return: 249.27 %
CAGR Return: 14.04 %
Max Drawdown: 7.9 %
Win percentage: 28.01 %
Profit Factor (Expectancy): 2.019
Average Loss: 0.33 %
Average Win: 1.69 %
Average Time for Loss: 1 day
Average Time for Win: 5.33 days
1 Day:
Number of Trades: 429
Gross Return: 458.4 %
CAGR Return: 15.76 %
Max Drawdown: 6.37 %
Profit Factor (Expectancy): 2.804
Average Loss: 0.8 %
Average Win: 7.2 %
Average Time for Loss: 3 days
Average Time for Win: 16 days
5 Day:
Number of Trades: 69
Gross Return: 1614.9 %
CAGR Return: 26.7 %
Max Drawdown: 5.7 %
Profit Factor (Expectancy): 10.451
Average Loss: 3.64 %
Average Win: 81.17 %
Average Time for Loss: 15 days
Average Time for Win: 85 days
Analysis:
The strategy is typical amongst trend following strategies with a less regular win rate, but where profits are more significant than losses. Most of the losses are in sideways, low volatility markets. This strategy performs better on higher timeframes, where it shows a positive expectancy of the strategy.
The average win was positively impacted by Bitcoin’s earlier smaller market cap, as the percentage wins earlier were higher.
Overall the strategy shows potential for further development and may be suitable for walk-forward testing and out of sample analysis to be considered for a demo trading account.
Note in an actual trading setup, you may wish to use this with volatility filters, combined with support resistance zones for a better setup.
As always, this post/indicator/strategy is not financial advice, and please do your due diligence before trading this live.
Original indicator links:
On chart version -
Oscillator version -
Update - 27/06/2022
Unfortunately, It appears that the original script had been taken down due to auto-moderation because of concerns with no slippage / commission. I have since adjusted the backtest, and re-uploaded to include the following to address these concerns, and show that I am genuinely trying to give back to the community and not mislead anyone:
1) Include commission of 0.1% - to match Binance's maker fees prior to moving to a fee-less model.
2) Include slippage of 10 ticks (This is a realistic slippage figure from searching online for most crypto exchanges)
3) Adjust account balance to 10,000 - since most of us are not millionaires.
The rest of the backtesting parameters are comparable to previous results:
Backtesting parameters:
Initial capital: 10000 dollars
Position size: 10% of equity
Long stop: 2% below entry
Short stop: 2% above entry
Repainting: Off
Smoothing: SMA
Period: 10
Slippage: 10 ticks
Commission: 0.1%
This script still remains to shows viability / profitablity on higher term timeframes (with slightly higher drawdown), and I have included the backtest report below to document my findings:
8 Hour:
Number of Trades: 1082
Gross Return: 233.02%
CAGR Return: 14.04 %
Max Drawdown: 7.9 %
Win percentage: 25.6%
Profit Factor (Expectancy): 1.627
Average Loss: 0.46 %
Average Win: 2.18 %
Average Time for Loss: 1.33 day
Average Time for Win: 7.33 days
Once again, please do your own research and due dillegence before trading this live. This post is for education and information purposes only, and should not be taken as financial advice.

Dead Simple Heikin Ashi Candles (HA Candles)Are you looking for a dead simple calculation of the Heikin Ashi candles as they are calculated in tradingview? Here it is!
I was looking through the library and I saw that many have come up with a lot of awesome scripts using heikin ashi candles. But, I can't find anywhere that had the straightforward simple version of how Tradingview calculates them. This was a problem for me because I realized after punching the formula in that TradingView doesn't calculate HA candles in the original way.
You might say they don't calculate them the "right" but, spoiler alert, there is no right in trading. You can only be rational or irrational as you make money or lose money.
This is useful to me for building out some portions of an algo that are not going to be compatible with the built-in function. It happens. So, if you were looking for it too, hopefully it saves you some time.
For reference the original calc of HA candles is:
o = (prev_HA_open + prev_HA_close) / 2
h = math.max(high, ha_open, ha_close)
l = math.min(low, ha_open, ha_close)
c = ohlc4
Trade Well.
[RESEARCH] Heikin-Ashi Chart IdentifierA deterministic approach to identify Heikin-Ashi chart type.
The script checks the next statements about HA:
HA chart does not have any gaps in a classic sense
Every new HA open price is calculated using a specific recurrence formula. This fact also means that initial HA open price is used to calculate all the next and so on (a construction of Infinite Impulse Response filters)
The script works correctly being applied to other chart types:
Classic Candlestick
Range Bars
Line Break
Traditional Renko
ATR Renko
Traditional Point-and-Figure
ATR Point-and-Figure
Kagi
For special ones: this code allows you to check whether your script is being executed with Heikin-Ashi candles or not inside your script.
Ev sistr 'ta Laou!

Kozlod - Heikin-Ashi Bar Color Change StrategyYou can use this script to backtest Heikin-Ashi bar color change strategy.
You have to apply this script to usual candles and not Heikin-Ashi!!!
Background color indicates HA bar color. On change you'll see green/red arrows and alert will be fired.
Also you can find in the code calculations of all HA OHLC values.
